Power of 3 Strategy: How to Use It in Your Crypto Trading
You were right about the direction and still got stopped out. The power of 3 strategy explained with a real Bitcoin chart: accumulation, manipulation and distribution, and the two ways I enter.


Go pull up your last five losing trades. My bet is that in about three of them, you were right. Right direction, right idea. You got in during the accumulation, got stopped out in the manipulation, and price ran to your target without you.
That's the power of 3 strategy. A market moves through accumulation, manipulation and distribution, and the manipulation phase exists to take you out right before the real move. It's my favorite setup, and it still gets me sometimes.
In 2017 I traded price action breakouts. I got a lot right that year, but I was still a rookie. I didn't understand liquidity or mass psychology yet, and the power of 3 wasn't even on my radar. Here's what I know now. Breakouts in crypto, the majority of the time, are fake. Price fakes out one direction to pull rookie traders in, then goes the other way. The power of 3 is the map of how that happens.
What is the power of 3 in trading?
The power of 3 (also written PO3, or AMD) is a market structure pattern with three phases:
- Accumulation. Price holds a range and both sides commit to a direction.
- Manipulation. A sharp move out of the range the wrong way, through the stops and liquidations sitting just beyond it.
- Distribution. The real move.
It shows up on every timeframe, from the daily down to the 15 minute, at highs and at lows, so it works for longs and for shorts. Here's one I marked up on the Bitcoin 6 hour chart.
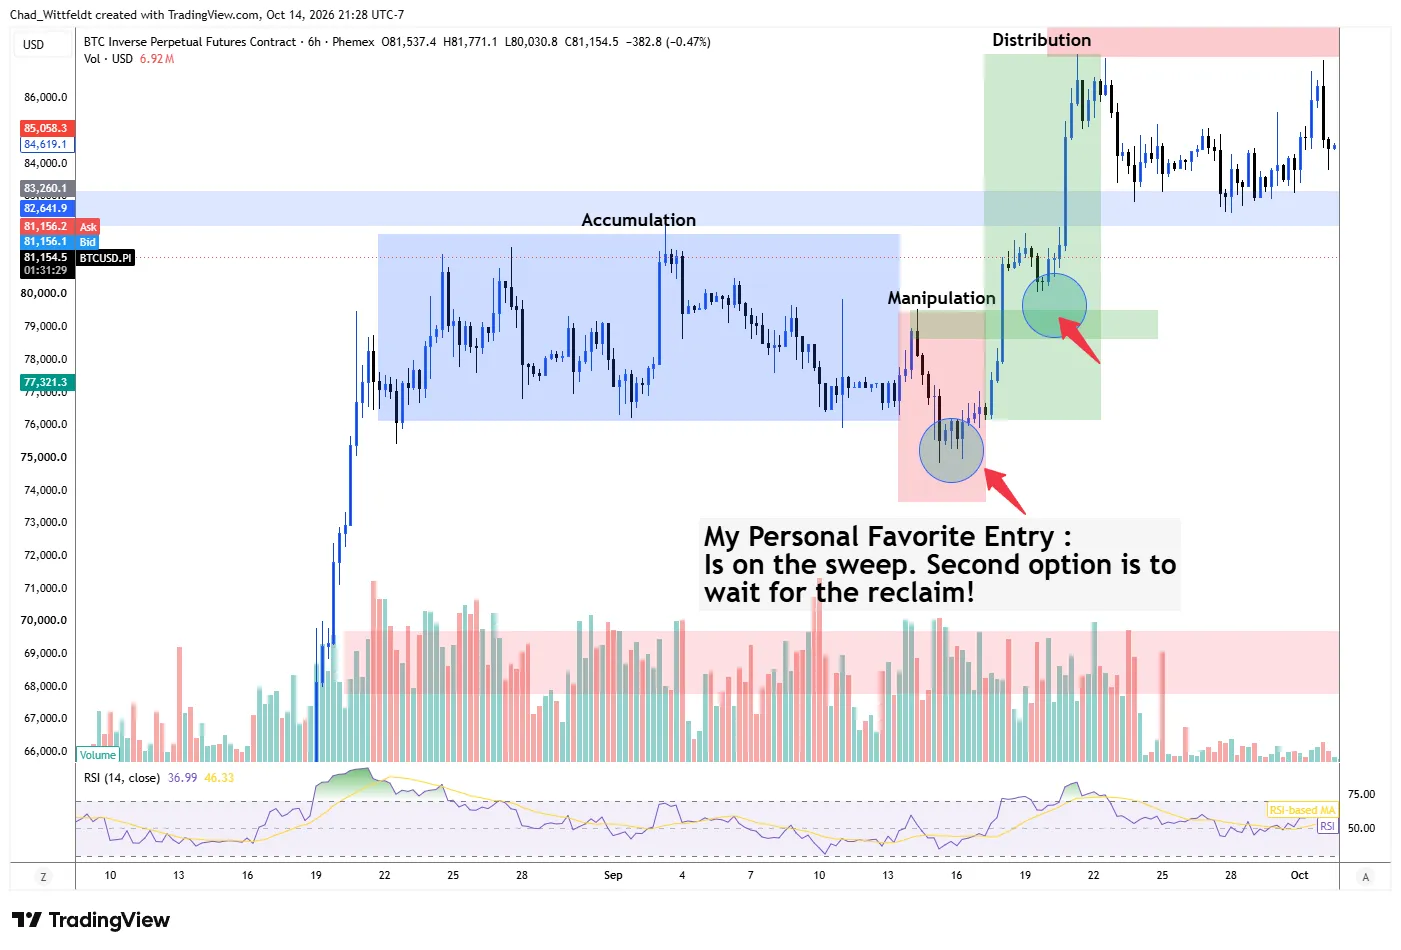
Price ranged between roughly $76,000 and $80,000 from late August into mid September. Then it dropped below the range to about $75,000, took out the longs' stops, and ran to about $87,000 within a week. Anyone who bought the range and put their stop under it was right about the direction and still lost.
What happens in each phase?
Accumulation gets traders to commit. The shorts see an M pattern and divergence. The breakout traders see a bull flag, and if there's a major resistance level just above the range, a break of it pulls in late longs. Both sides put their stops in the obvious place, just beyond the range.
Manipulation asks one question. Where does price need to go to deliver the most pain to the most people? It runs those stops, it looks like a breakout, the late traders pile in, and then it snaps back on them. The early traders lose confidence in a thesis that was right. That run through the obvious level is a liquidity sweep. In my experience, the manipulation move typically pushes about 2.5 to 3% beyond the range.
Distribution is the move you called in the first place, playing out without you. If you've ever been stopped out on a random spike and watched price hit your target the next day, you've experienced the power of 3. You just didn't enjoy the experience very much.
In my experience, leverage tends to get taken out first and spot builds the move. Leveraged traders tend to be early, and early is exactly what the manipulation phase punishes.
Market makers aren't the bogeyman in this. We wouldn't have a market without them. They need orders to fill against, and the most orders sit where the most traders put their stops. Once you know that, you can stop being those orders.
Why do breakouts keep trapping you?
Because the breakout is usually the manipulation. That's why I don't trade bull flags, bear flags or lower timeframe breakouts. I'll give them some respect on the daily chart. On the 15 minute, way too often the breakout above the range is the fake out takeout, and the real breakout happens on the other side after everyone's been wiped out.
You can usually see it coming. Early in a push the candles are big and vertical. As the move tires they get smaller and spread sideways. Price can still make a higher high, but not with the same speed. That's exhaustion, and it's an early sign of a change of character. The next impulse to the high is the one that traps people. I'm doing the exact opposite of what looks obvious.
If you trade M and W patterns, the right leg tends to be the manipulation phase. The break of market structure after it is your confirmation that distribution has started.
How do you find a power of 3 on a chart?
Look for three things in order:
- A range. Price holds between a clear high and a clear low and moves around inside it.
- One level outside the range. Price drops (or rises) one level beyond it and builds a smaller range there. The old range low often becomes resistance for that manipulation range.
- The run back through. Price leaves the manipulation range and makes the real move the other way.
Some of the simplest swing trades we've taken came from exactly this on the daily chart. A range, a manipulation below it and heavy bullish divergence on the RSI from low to low. Nothing else. Two different coins, the same setup, on the same timeframe.
What timeframe works best for the power of 3?
Whatever fits the whole structure on your screen. It looks almost the same on the 4 hour, 6 hour, 12 hour and daily. On a big monitor that's the 4 hour. On a laptop you might need the daily.
You'll also find a power of 3 inside a power of 3. The manipulation on the 1 hour chart can have its own accumulation, manipulation and distribution on the 15 minute, and the lower timeframe distribution often ends up being the higher timeframe manipulation. Timeframe imposition explains how the small structures build the big ones.
How do you enter a power of 3 trade?
My personal favorite entry is on the sweep. The second option is to wait for the reclaim.
- On the sweep. You enter inside the manipulation move while it's happening. It's less confirmed, because price moves fast and can overextend, but the stop is tight and the risk to reward is much better. I have a less printable name for this one, because watching a giant candle run straight at your order on the 15 minute chart takes some nerve.
- On the reclaim. You wait for price to come back into the range and break structure in the real direction. More confirmed, and you give up some risk to reward for it.
Either way, the stop goes at your invalidation level and the position size comes from it.
What if the manipulation never comes? It happens. In my trading the sweep shows up about 70 to 80% of the time. So either wait for it and accept you'll miss a few, or split your entry. Put part of your planned risk on now and save the rest for the sweep. If the sweep comes, the second fill improves your average entry. If it doesn't, you're still in. I'd rather miss a few trades by being patient than keep getting stopped out on a thesis that was right.
And you usually have more time than you think. The bigger the move, the longer the structure takes to build. A 10 to 15% pullback on Bitcoin usually builds for days, not minutes. I set alerts days ahead at the levels where I'd take the trade, and anything in between, I don't trade.
What mistakes should you avoid?
- Only looking for your own side. Before you enter, ask what price would need to do to prove you wrong. If you feel like you're fumbling into a trade, you aren't the only one feeling that way.
- Ignoring what the other side sees. What are the longs doing right now? What are the shorts doing? Where are their stops and liquidations? How is price setting up to push each side the wrong way?
- Brushing off a stop loss. "Screw the market makers" teaches you nothing. Audit the trade instead. Did you check the liquidation levels? Did you mark the range? Had the manipulation happened yet? Every trade, win or lose, is a lesson if it goes in your trading journal.
How do you practice spotting it?
Set aside 30 minutes, scroll back through a chart and box up the accumulation, the manipulation and the distribution. Do it on Bitcoin, then on a coin you trade, then on a lower timeframe. Then go back to those last five losing trades and ask one question about each. Did I get in before the manipulation? If the answer keeps being yes, your analysis isn't the problem. Your timing is, and that's a lot easier to fix.
You don't have to make it your only strategy. It's an extra layer on top of whatever you already trade. And once you know it exists, a stop-out in the manipulation stops feeling like proof you were wrong. You got in one phase early, and you can get back in at the top of the manipulation range.
It's the same idea behind the market maker method, which counts three levels before looking for the reversal.
If you want to mark these up with people who trade them every week, join the Crypto Renegades Skool Community. It's free for a week, then $97/month. Try it free for a week.
This is education, not financial or investment advice.
Frequently asked questions
The power of 3 strategy reads a price move in three phases: accumulation, manipulation and distribution. Price builds a range, sweeps the stops on one side of it, then makes the real move the other way.
PO3 is short for power of 3. Some traders call it AMD after its three phases.
Accumulation, where price ranges and traders commit to a direction. Manipulation, a move out of the range that sweeps their stops. Distribution, the real move in the other direction.
It shows up across Bitcoin and altcoins, from the daily chart down to the 15 minute. It isn't there every time, so plan for a setup with no sweep.
The one that fits the whole structure on your screen. The pattern looks almost the same from the 4 hour to the daily.
Sources
General education only, not financial advice. Crypto and leverage involve substantial risk of loss. Read our risk disclosure.

Written by
Chad WittfeldtCo-Founder and Strategy Lead, Crypto Renegades
Chad first heard about Bitcoin in 2012, bought his first coin in 2013 at around $100, learned markets through forex in 2015 and went full time on crypto in 2017, posting public technical analysis on Bitcoin's break above $3,000 that August. That same year he flagged USI Tech and BitConnect as Ponzi schemes and warned the people around him before either one was exposed. He ran an Ethereum GPU mining operation from 2019 to 2021, and verification runs through everything he teaches.