Market Maker Method Explained: How to Trade It in Crypto
Count to three and look for two letters. The market maker method as I trade it in crypto, with a real Bitcoin chart: the weekend trap, the three levels, and the M or the W.

The market maker method comes down to one idea. Count to three and look for two letters. At the top of a third rise level, look for an M. At the bottom of a third drop level, look for a W. That's most of it, and you start the count from the weekend trap.
We didn't invent it. I learned from Wyckoff, from the market maker method and from auction market theory, and I kept what worked from all of them. This is how I apply the market maker method to crypto on our live Mastermind calls. Of everything I teach, I think it's the most reliable, and the easiest to learn, because you're only ever counting to three.
What is the market maker method in trading?
It's a way of reading price through liquidity. The market maker is the firm on the other side of your order, one that stands ready to buy or sell at quoted prices. To fill size, it needs a lot of orders on the other side, and the most orders sit where the most traders put their stops and liquidations. That's above the highs and below the lows.
So when liquidity gets taken from the highs, I look for shorts. When it gets taken from the lows, I look for longs. That's scary at first, because you're doing the opposite of what price looks like it's doing. But it's where the good risk to reward lives, and once you understand why the move happened, you trade it with a lot more conviction. Go with the obvious move after it's already happened and you end up shorting bottoms and buying tops. We want the reversal, not the tail end of a tired move.
Here's the cleanest example from this spring, on the Bitcoin 6 hour chart.
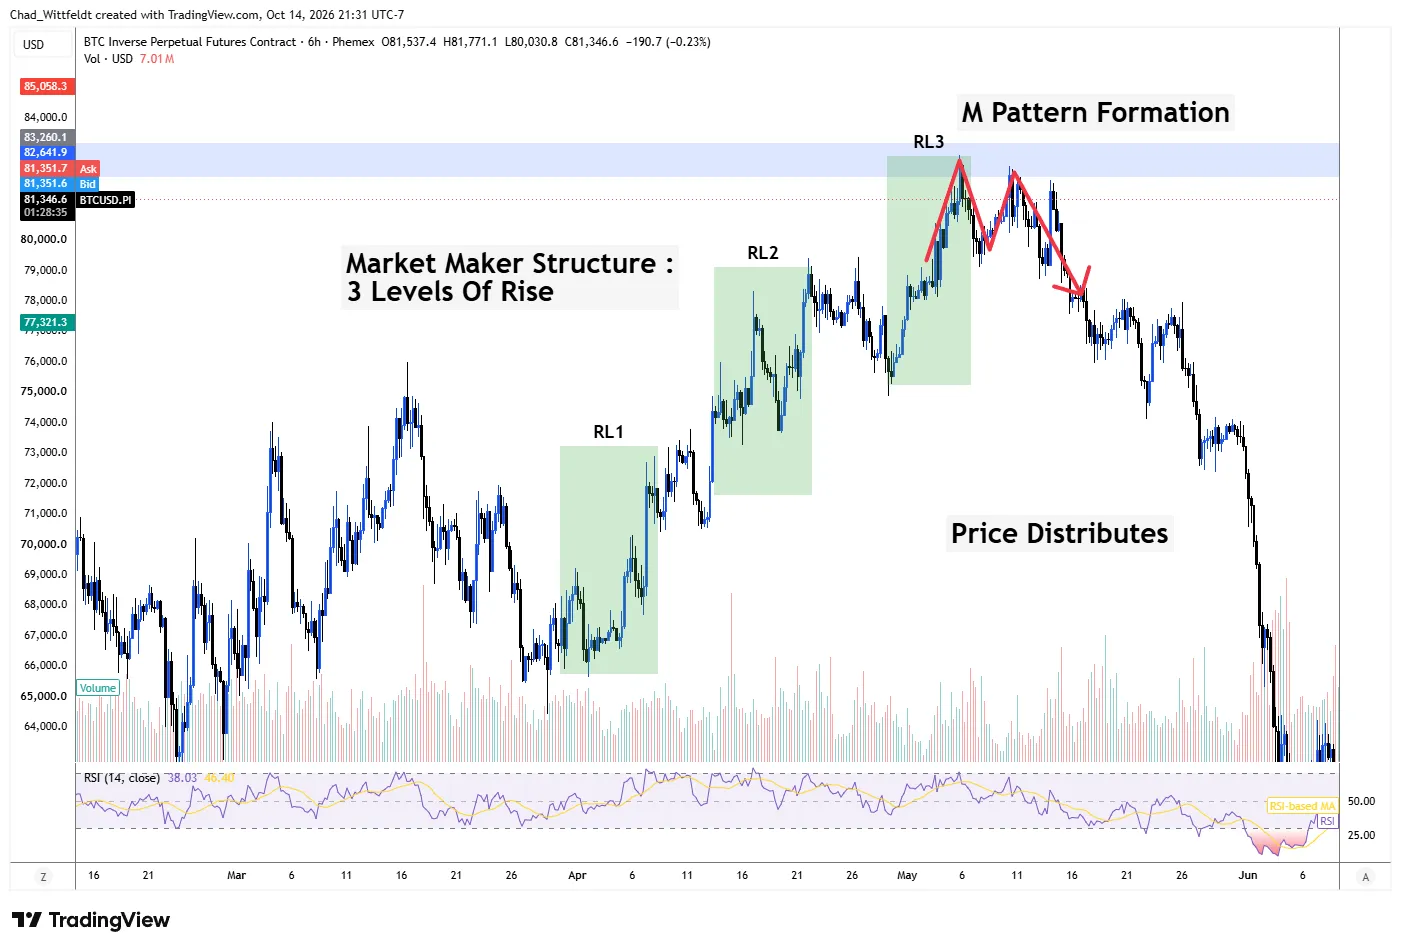
Three rise levels, from about $66,000 in early April to about $82,500 in early May. A pause between each one. Then an M at the top of the third, and price distributed all the way down to about $63,000 by early June. Anyone who saw a bull flag up there was buying the top.
Step 1: How do drop levels set your bias?
Go to a high timeframe and count the legs. A drop level is one leg of expansion down. A rise level is one leg up. After three, the move tends to run out of steam.
Use whatever timeframe fits the whole move on your screen. On a small laptop that might be the daily. On a bigger monitor the 12 hour or the 6 hour can show everything from the last all-time high to the most recent low.
The count is your bias. Three drop levels and you're looking for longs and a W. Only two, and you're still waiting for the third. That one difference explains a lot of arguments between traders looking at the same chart.
Step 2: Is the market in contraction or expansion?
Most of the time, the market isn't going anywhere. By my count, Bitcoin ranges about 70 to 80% of the time, and those ranges are usually somewhere around 15 to 20% from low to high. In a range, price slops back and forth and retraces 61.8%, 78.6%, sometimes the whole move. So take profits at planned targets, and save the long holds for expansion.
Here's a number I counted myself. Across the major higher timeframe ranges I went back and measured, most lasted somewhere between 30 and 50 days. It's not a line in the sand. It's a flag. Ranges tend to start right after a big expansion, and once one is pushing 50 days, I start watching for the next expansion.
And sometimes the range just doesn't fit how I trade. This summer the market chopped sideways, and for about a month and a half I didn't take a single trade. Sitting out is a position too.
Step 3: Where do you start the count?
At the weekend trap. It's the quiet stretch from Friday afternoon, after the New York session, into Sunday. Thin volume, small flat candles, no direction. A lot of traders close their positions by midday Friday, and I don't hold risk through it either. You're paying funding for nothing, and within a day or two you'll get a much clearer read. I mark it in blue every time.
Out of the weekend trap comes the fake move week beginning. It pushes price the wrong way to start the week, and it looks like a perfect breakout. A break of structure, then a clean retest. The breakout traders pile in, they're in profit, it pulls back for "a retest," and then it falls back into the range and stops them out. And God forbid you moved your stop.
Lately I've been seeing it on Saturday more often. If it hasn't happened by Sunday afternoon, expect it then. And the sloppier the weekend trap, the harder the week ahead usually is.
What do you look for at drop level three?
After the fake move, count the drop levels. I mark them in red, DL1, DL2, DL3. The bottom of the third is where untrained traders are most sure it's going lower, and where the move is most likely done. Before I take the long, I want:
- The location. The bottom of drop level three, after the weekend trap and the fake move.
- A W. Ideally the right leg sweeps the low.
- RSI divergence. Price makes lower lows while the RSI makes higher lows. Sellers are running out of gas.
- The time of week. Typically I look for a Tuesday or Wednesday midweek reversal.
Then there's the wick. A long wick on the right leg of the W, or a stopping volume candle, where price drops hard, stops, and the next candles are small. The wick shows that sellers pushed price down and buyers took it all back inside that one candle. When everything else is already there, that's extra gravy on the potatoes. But you can't trade wicks on their own. Location is everything. A W at the bottom of drop level one isn't a setup. Neither is an M at the top of rise level one. That's usually just a pause.
When every box is checked, I don't wait for more confirmation. I'll enter on the close of the wick candle with the stop beyond the wick, and size it from that stop with the position sizing formula.
If the weekend trap or the fake move looks sloppy, skip it and wait for the three day swing into the midweek reversal. Nothing says you have to trade the start of the week.
Does a single session M or W count?
It counts, but it's weaker. An M or a W that forms inside one trading session, with both legs in the New York session for example, tends to have less follow-through. One that forms across sessions, with the left leg in New York and the right leg in Asia, tends to be stronger. As a rule, the bigger the pattern and the longer it took to build, the bigger the move that follows. Same goes for head and shoulders and cup and handle patterns.
What is a boardroom?
The pause between levels. To see how deep it should pull back, put your Fibonacci on that one level only. Don't include the earlier levels, or you'll get the wrong reading. The 50% retracement is the most common target. Very often price holds the 50, makes a fake W, sweeps fast to the 61.8 and recovers. If it runs back to the 78.6 or the base of the level, the boardroom is invalidated, and so is the next level you were expecting. Enter at the lows of boardrooms, not the highs.
Where do you take profit?
At the top of rise level three, taking profit is the priority, and your eyes switch to looking for the M. Use the structure to the left to set the take profit before you enter. In a range, price tends to travel from one extreme to the other, though you're never owed the extreme.
Sometimes it runs a bit further after you close. You're going to leave a little licorice on the table, and that's fine. Give it a day and it's often right back where you sold. The one that actually hurts is catching the bottom of drop level three and closing at rise level one.
And there's no such thing as always. No setup, no wick, no count. The only always is that there will be variance.
What mistakes should you avoid?
- Entering late. Price breaks below the range at the bottom of drop level three, people start celebrating the short, and it reverses on them almost right away. If you've counted your levels, you know you're at the end of the move, not the start.
- Forcing a B setup at full risk. Grade your setups. Your A setup gets your normal risk per trade. If it's a B setup and you still want it, cut the risk way down. Don't force a weaker trade with full size. It's fine to wait for a better one.
- Not taking profit at the top of rise level three, because greed convinces you it's a bull flag that's going to keep going.
Which coins does the market maker method work on?
It's cleanest on Bitcoin and Ethereum by a long way, with Solana close behind. The further out into altcoins you go, the sloppier it gets. Most of the market moves together, so you can build the thesis on Bitcoin and carry it over. Just expect the altcoins to be noisier and more aggressive, and keep an eye on your total exposure when several positions are really the same bet.
How do you practice it?
Back test it. Pick a weekend trap on the 15 minute chart, mark it in blue, mark the fake move, count the drop levels in red and the rise levels after them, and find the Ms and the Ws. Then do the same through a whole range. It feels like a waste of time because you can't trade the past. But do it enough and you'll see it live. When someone in the trade chat says there's a W on Bitcoin, you'll know whether you're at the bottom of drop level three or just in a boardroom.
The same thinking sits under the power of 3 and the liquidity sweep.
If you want to mark these up with us every week, join the Crypto Renegades Skool Community. It's free for a week, then $97/month. Try it free for a week.
This is education, not financial or investment advice.
Frequently asked questions
It's a way of reading price through liquidity: where the stops and liquidations sit, and how price moves to take them. You count three drop levels and look for a W at the bottom, or three rise levels and look for an M at the top.
The weekend trap is the low-volume range from Friday afternoon, after the New York session, into Sunday. It's usually followed by a fake move that pushes price the wrong way to start the week.
A drop level is one leg of expansion down, and a rise level is one leg up. After the third, the move tends to run out of steam.
A boardroom is the pause between two levels. It most often pulls back to the 50% of the level before it, and a pullback to the 78.6% or the base of the level invalidates it.
It's cleanest on Bitcoin and Ethereum, with Solana close behind. The further out into altcoins you go, the noisier it gets.
Sources
General education only, not financial advice. Crypto and leverage involve substantial risk of loss. Read our risk disclosure.

Written by
Chad WittfeldtCo-Founder and Strategy Lead, Crypto Renegades
Chad first heard about Bitcoin in 2012, bought his first coin in 2013 at around $100, learned markets through forex in 2015 and went full time on crypto in 2017, posting public technical analysis on Bitcoin's break above $3,000 that August. That same year he flagged USI Tech and BitConnect as Ponzi schemes and warned the people around him before either one was exposed. He ran an Ethereum GPU mining operation from 2019 to 2021, and verification runs through everything he teaches.